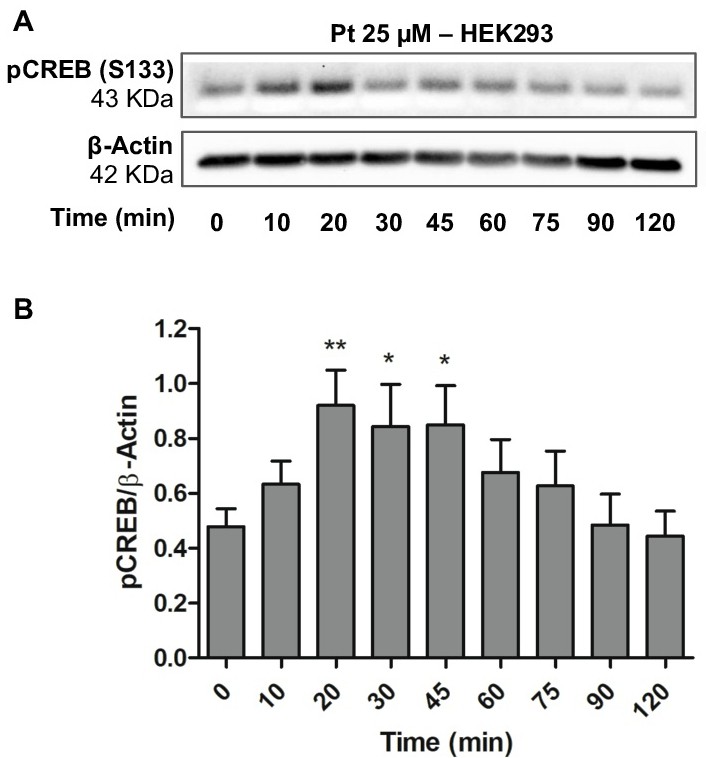
Fig. 3. Western Blot analysis of pCREB. (A): a representative Western Blot. (B): histogram of the average densitometry data. Statistics: Repeated measures one way ANOVA test with Dunnett's correction. *,**: p ≤ 0.05, ≤0.01 with respect to control (t = 0), respectively. N = 7. Error bars represent +SEM.